The pivotal Balance trial1
The efficacy of TRYNGOLZA was evaluated in 45 adults with FCS. Participants were randomized to receive TRYNGOLZA or placebo once every 4 weeks for 6 months* for the primary analysis, and were continued over a 12-month† treatment period.1,21 There were 23 participants in the placebo arm and 22 in the TRYNGOLZA arm.1
*Average of Weeks 23, 25, and 27.1
†Average of Weeks 51 and 53.21


Genevie, living with FCS and a paid speaker for Ionis.
TRIAL DESIGN
Participants were randomized to receive TRYNGOLZA or placebo once every 4 weeks for 6 months* for the primary analysis, and were continued over a 12-month† treatment period.1,21
Participant demographic and baseline characteristics were generally similar across treatment groups.1 For more trial design information, click here.
Criteria for the trial included:
- Fasting triglyceride levels ≥880 mg/dL1
- Genetically identified FCS based on variants in genes known to cause complete or partial deficiency in LPL function.‡ Participants with indeterminate genetic test results were confirmed to have FCS through adjudication by subject matter expert1,20
- ≥4-week run-in period where patients followed a low-fat diet of ≤20 grams of fat per day1
Primary endpoint:
- Mean percent change in fasting triglycerides from baseline to Month 6* compared with placebo1
*Average of Weeks 23, 25, and 27.1
†Average of Weeks 51 and 53.21
‡Variants were LPL, APOA5, GPIHBP1, LMF1, or APOC2.20
APOA5=apolipoprotein A5; APOC2=apolipoprotein C2; GPIHBP1=glycosylphosphatidylinositol-anchored high-density lipoprotein binding protein 1; LMF1=lipase maturation factor 1; LPL=lipoprotein lipase.
Select secondary and additional endpoints1,5,21,22:
- Mean percent change in fasting triglycerides from baseline to Month 12 compared with placebo22
-
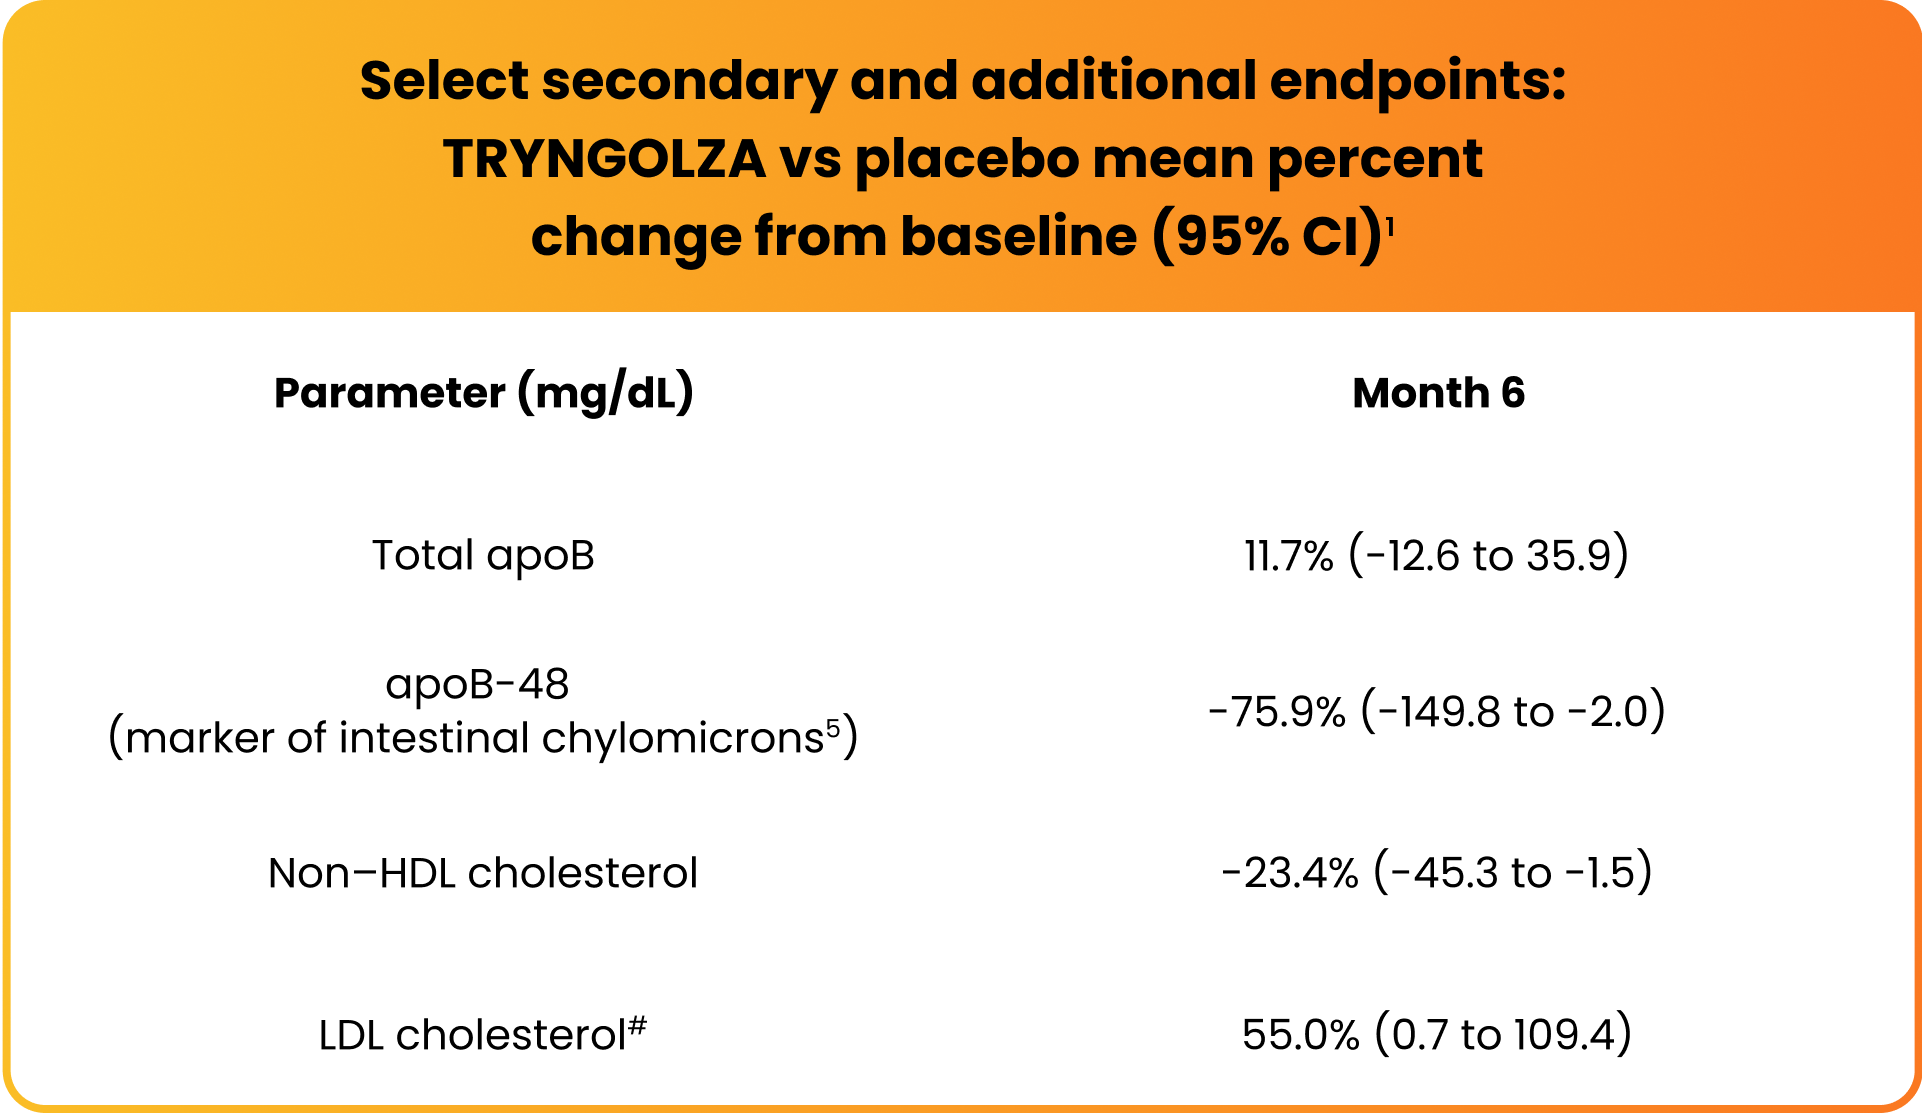
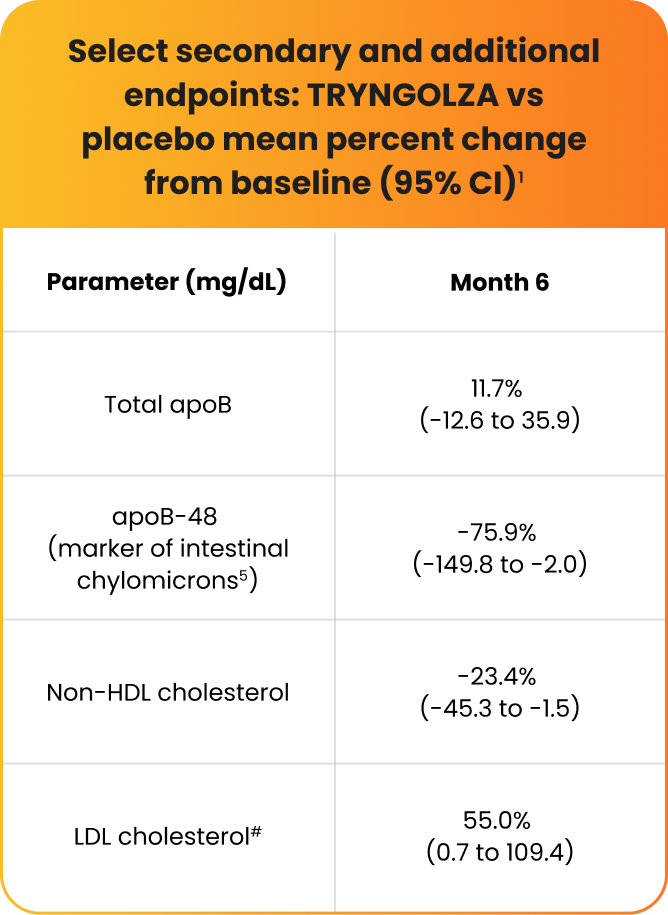
Mean percent changes from baseline at Month 6 compared with placebo in fasting:
- Total apoB1
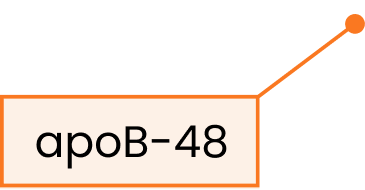
- apoB-48 (the only specific marker of intestinal chylomicrons)1,5
- Non–HDL cholesterol1
- LDL cholesterol1
- Adjudicated pancreatitis events and number of participants affected during treatment period1,21
apoB=apolipoprotein B; apoB-48=apolipoprotein B-48; LDL cholesterol=low-density lipoprotein cholesterol; non–HDL cholesterol=non–high-density lipoprotein cholesterol.
Significant reduction in fasting triglycerides at Month 6 with continued reductions observed at 1 year compared with placebo1,22
The primary endpoint of the Balance study was mean percent change in fasting triglycerides from baseline to Month 6 (average of Weeks 23, 25, and 27) compared with placebo.1

-42.5%
at Month 6
significant mean change in fasting triglycerides compared with placebo
(95% CI, -74.1 to -10.9; P=0.0084)1§
-56.9% at Month 12
mean change in fasting triglycerides compared with placebo
(95% CI, -103.4 to -10.5)22§||
*Average of Weeks 23, 25, and 27.1
†Average of Weeks 51 and 53.21
§Difference from baseline mean fasting triglyceride levels of 2604 mg/dL.1
IIMissing data were imputed using placebo washout imputation. The 95% CIs of treatment differences were calculated using a robust variance estimator.1
Rapid triglyceride reductions with consistent control over 1 year1
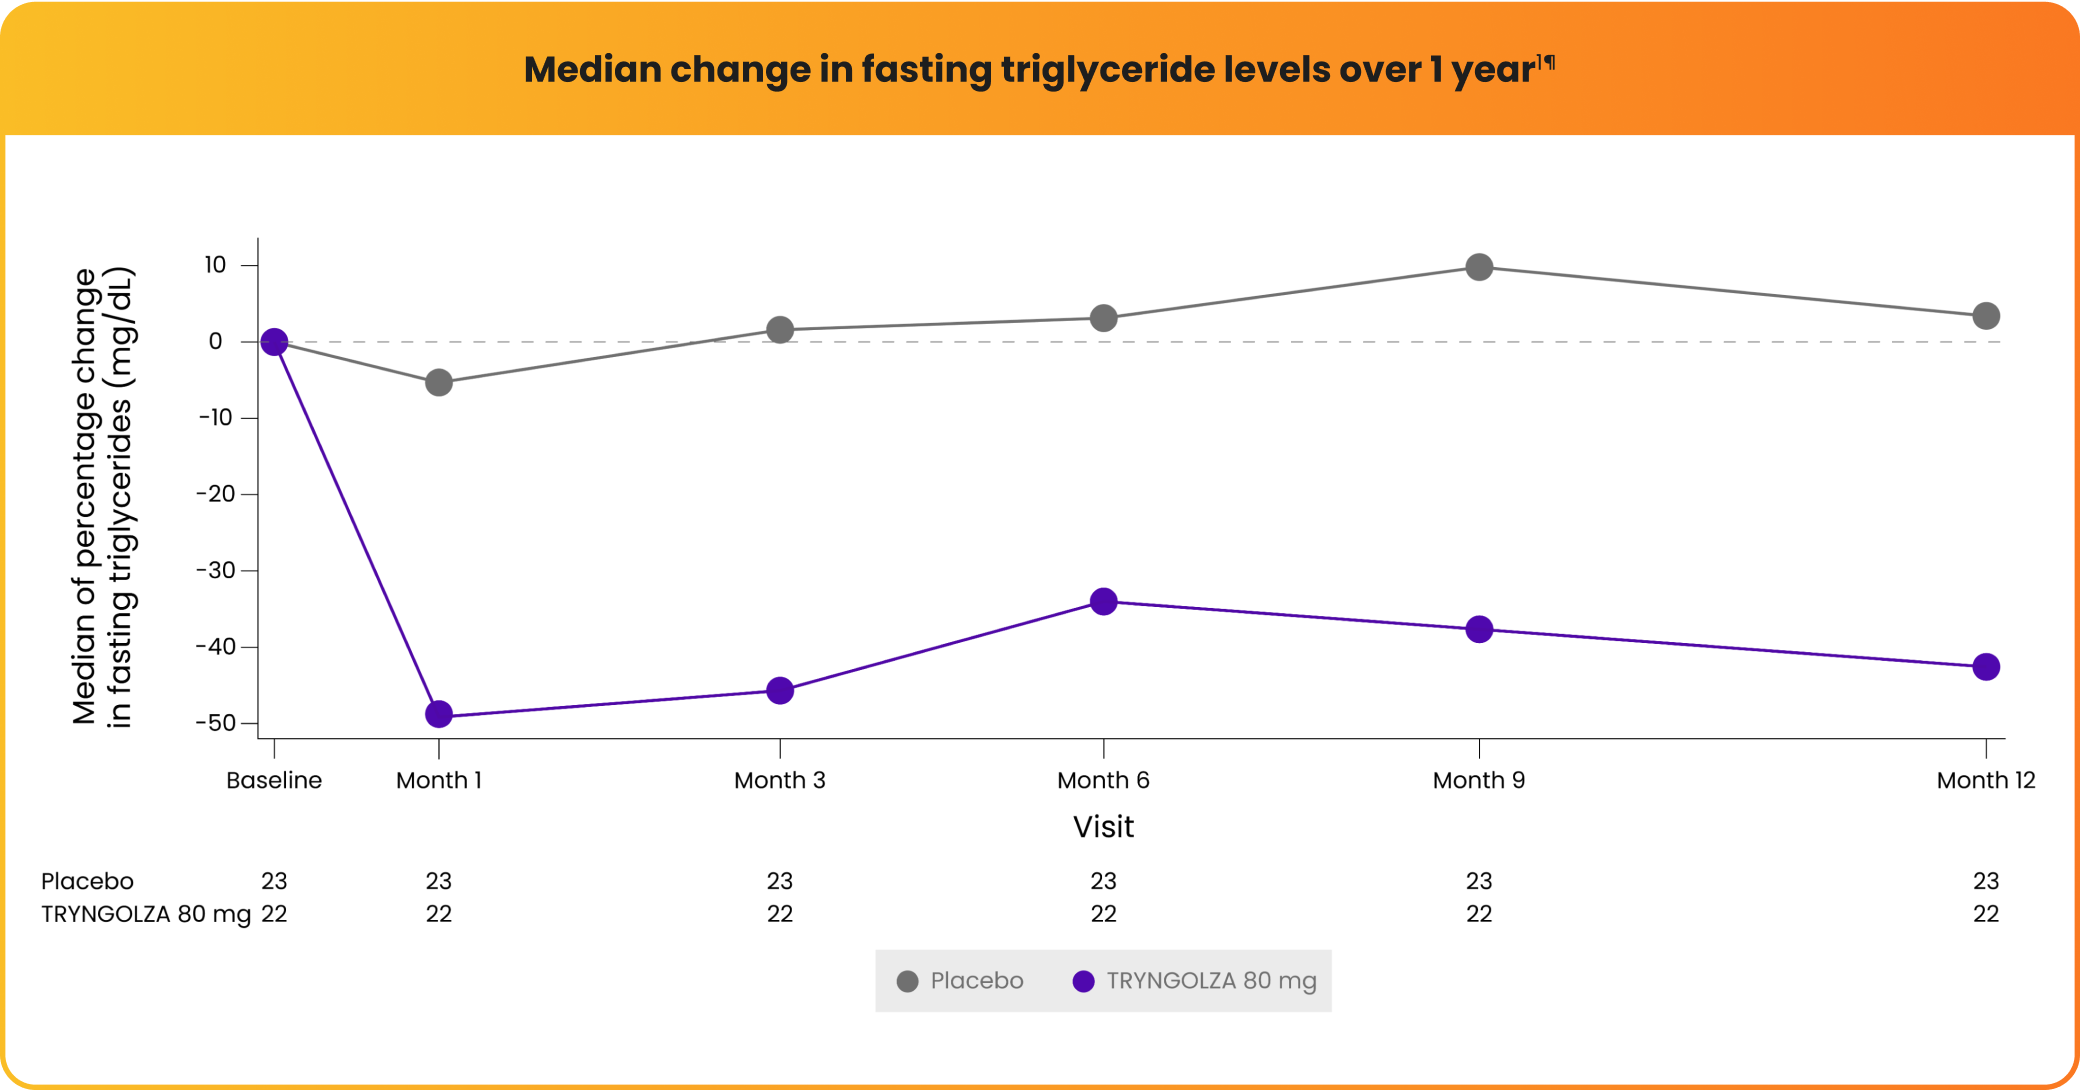
Median change in fasting triglyceride levels over 1 year1¶
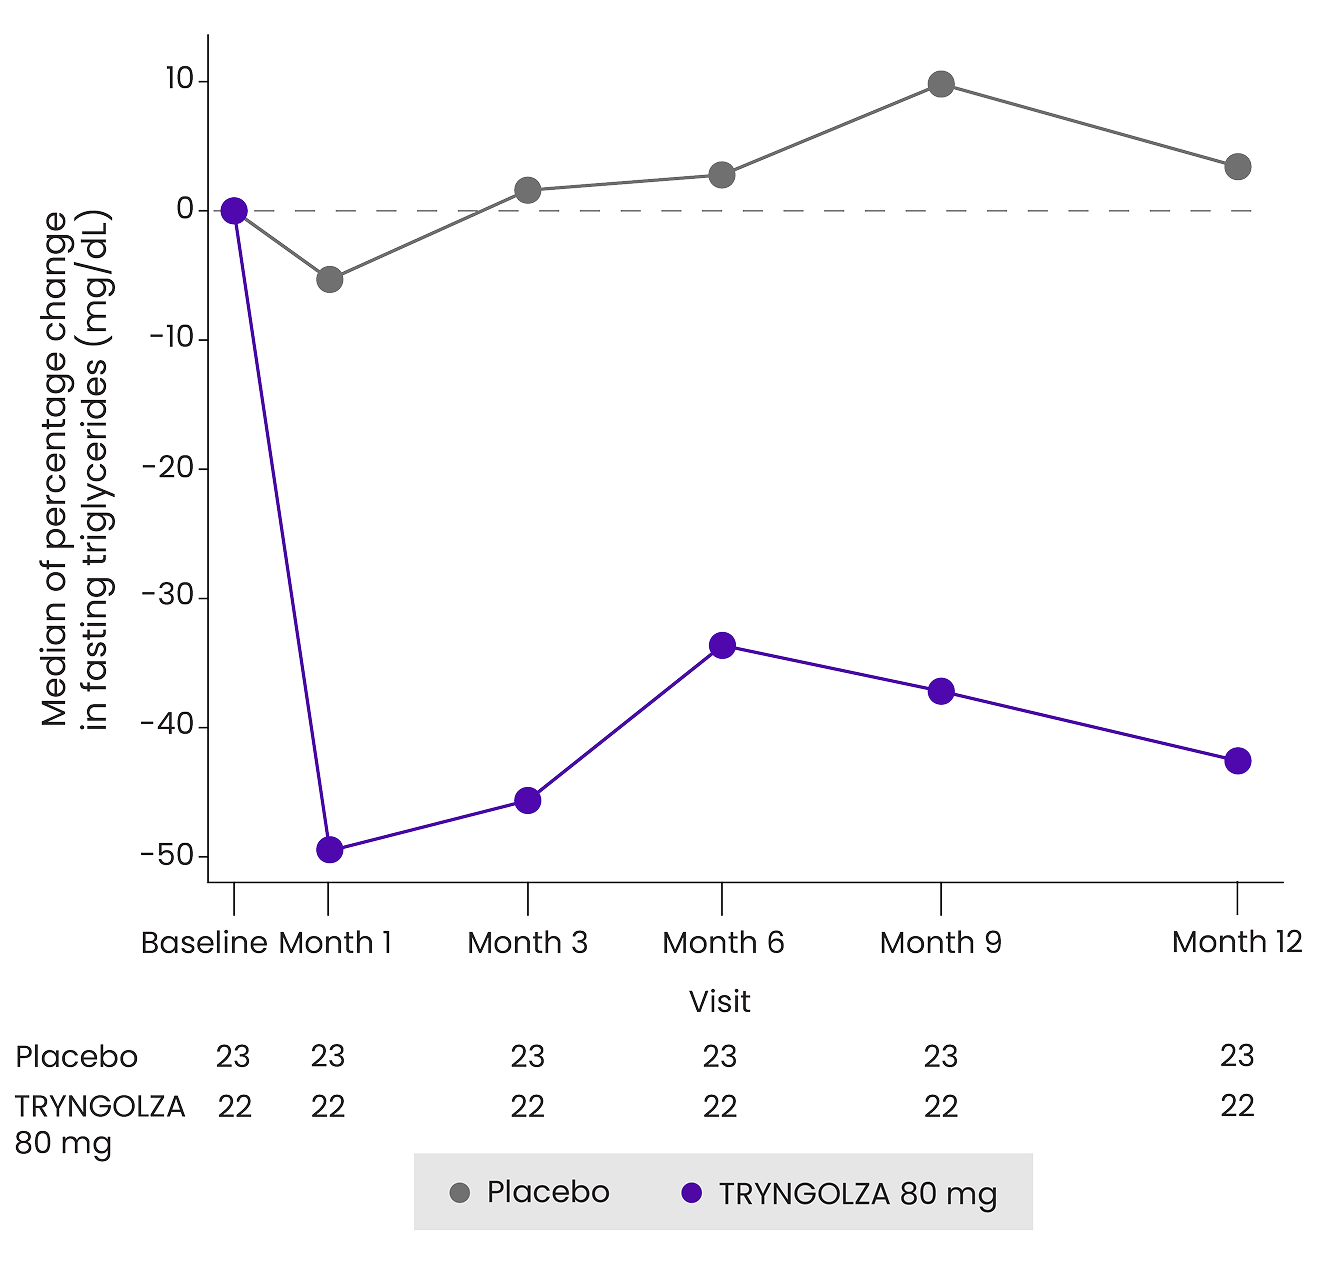
¶Baseline median fasting triglyceride levels were 2303 mg/dL.1
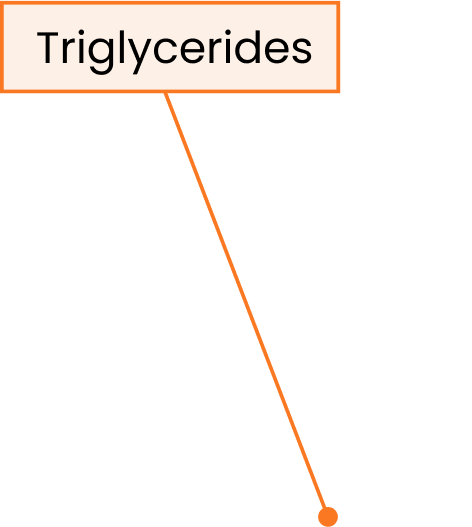
Changes observed in lipid/lipoprotein parameters1
Mean LDL cholesterol levels increased but remained within normal range (ie, <70 mg/dL) for 74% of participants treated with TRYNGOLZA.1



IIMissing data were imputed using placebo washout imputation. The 95% CIs of treatment differences were calculated using a robust variance estimator.1
#Baseline LDL cholesterol levels were 22.8±14.1 mg/dL in the TRYNGOLZA arm vs 16.7±8.4 mg/dL in the placebo arm.20
**Reached statistical significance (P<0.05).1
apoB-48=apolipoprotein B-48; LDL cholesterol=low-density lipoprotein cholesterol; non–HDL cholesterol=non–high-density lipoprotein cholesterol.


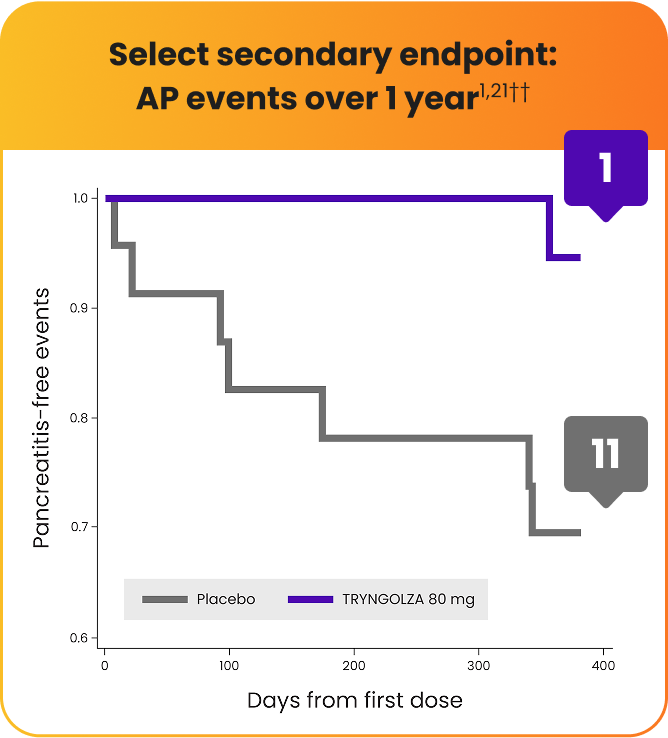
Lower incidence of acute pancreatitis (AP) with TRYNGOLZA1,21
The numerical incidence of AP in participants treated with TRYNGOLZA was lower compared with placebo.21
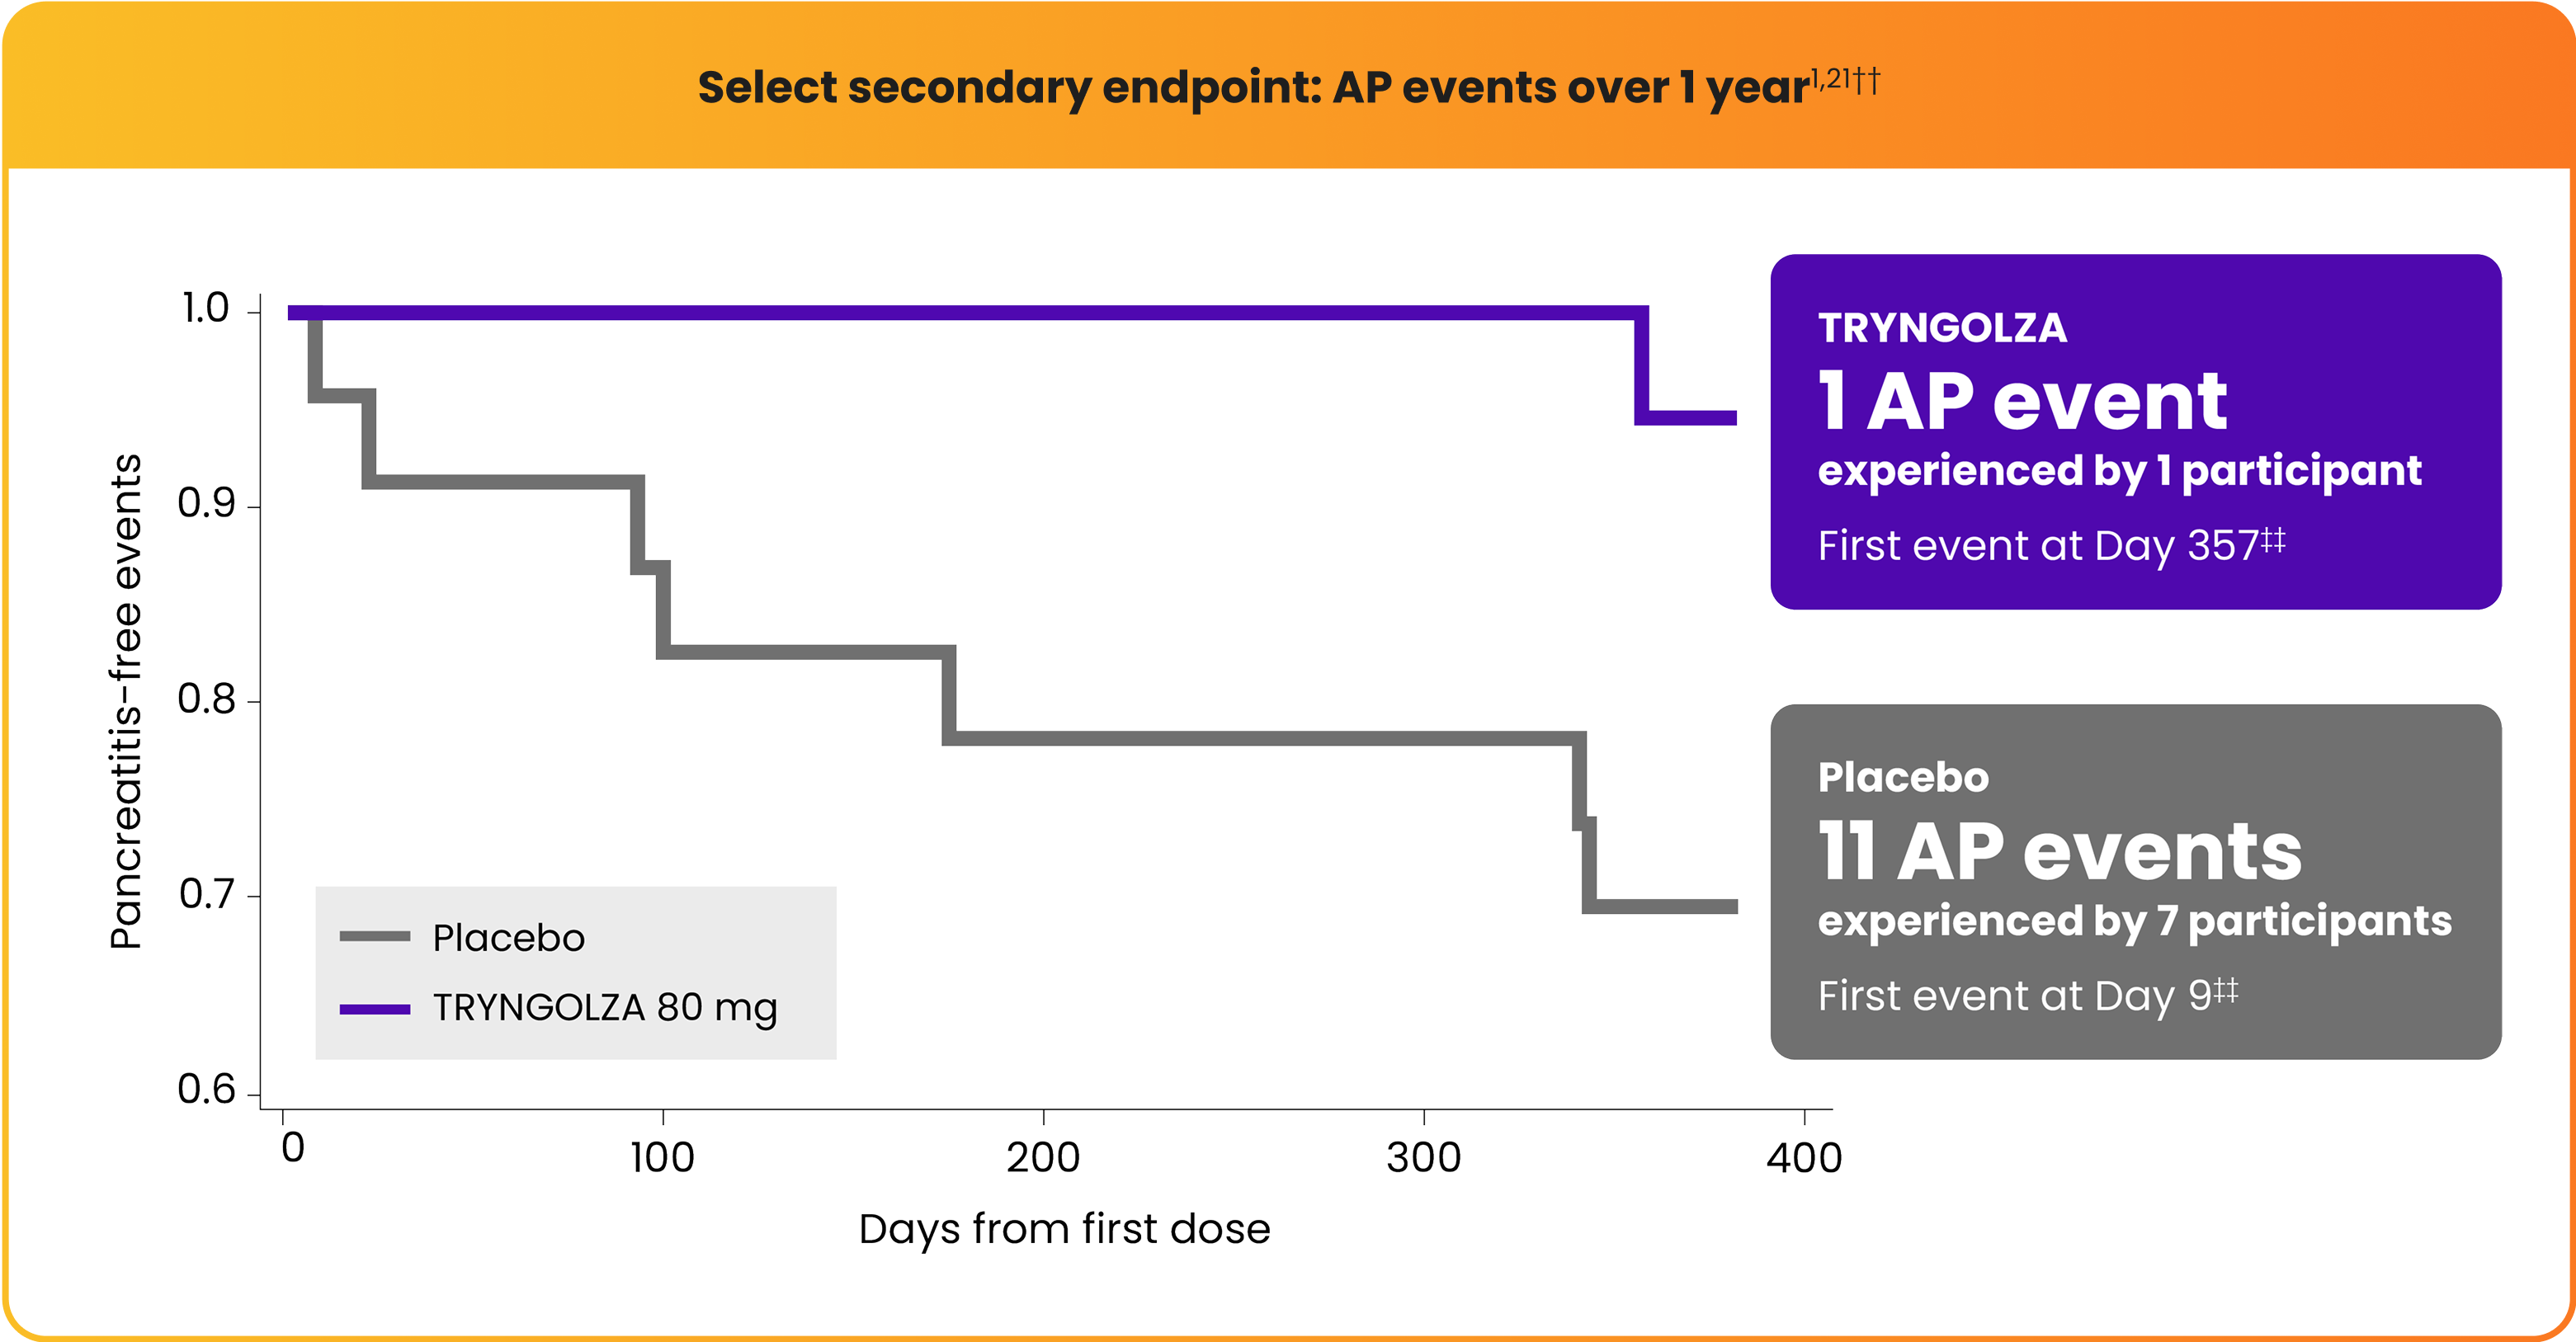
TRYNGOLZA
1 AP event
experienced by 1 participant
First event at Day 357††
Placebo
11 AP events
experienced by 7 participants
First event at Day 9‡‡
††Adjudication based on Atlanta classification; if serum lipase and/or amylase activity was less than 3 times the upper limit of normal, imaging (preferably contrast-enhanced computed tomography) was considered to confirm the diagnosis of acute pancreatitis.21
‡‡Time to first AP event was an ad hoc analysis.

